When addressing climate change and climate variability over large regions, gridded data are often preferred to station-based data because they help avoiding bias arising from the irregular spatial distribution of the observations. Gridded data refers here to spatially interpolated values from a finite set of spatially scattered individual observations, usually on a regular mesh of points or cells.
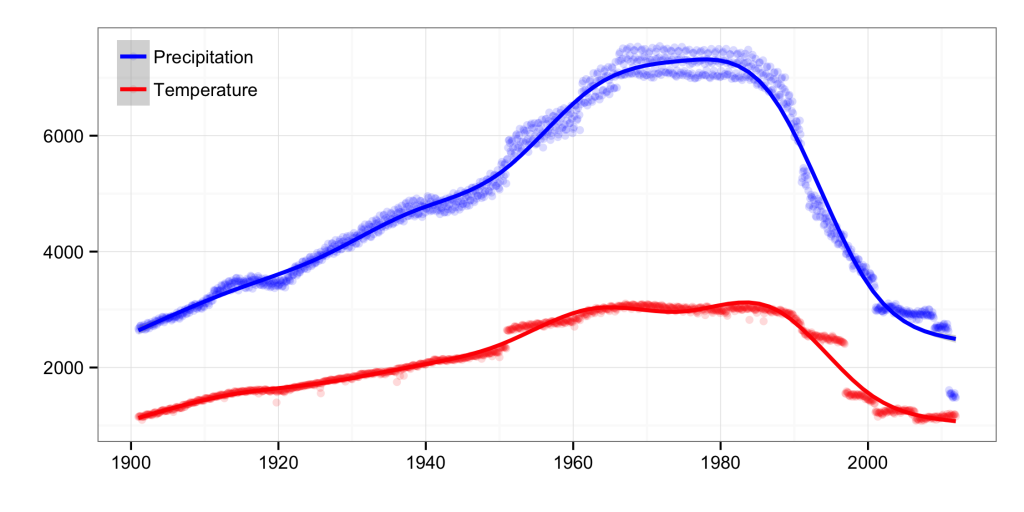
Spatial interpolation methods used to produce climatic gridded datasets are very varied, and they usually do a good job at preserving the mean of the data. Indeed, providing a good, unbiased, estimation of the mean values of the variable at different spatial locations is the primary objective of these methods. However, in most cases this techniques do not offer an adequate representation of their variance. In fact, the grid’s variance depends largely on the spatial density of observations used for constructing it. When one analyses the global and regional climate data sets that are in current use by the scientific community, one discovers that they are all characterized by large temporal changes in the number of observations available for interpolation. After a progressive increment in the number (and thus the spatial density) of observations during the 20th Century, a strong reduction occurred in the last 30 years or so.

Time series of the number of ground stations in the CRU TS 3.21 dataset for precipitation and temperature.
The frequency and magnitude of extreme events such as heat waves and droughts in a context of climate change depend more on changes in the variance than in the mean of climatological variables (Katz and Brown, 1992; Schär et al., 2004). Therefore, the question of whether climate variability (variance) is increasing with climate change is a crucial one. Recently, a number of studies reported little or no increase in climate variability at the global scale, both for temperature (Huntingford et al., 2013) and for precipitation (Sun et al., 2012; Greve et al., 2014), and no relevant change in the occurrence of extreme events such as droughts has also been highlighted (Sheffield et al., 2012). Since these and other similar studies relied on gridded data, a relevant question is whether or not their analysis may be affected by variations in the number of observations during their study periods, and most notably by the data reduction found in all data sets since the 1980s.
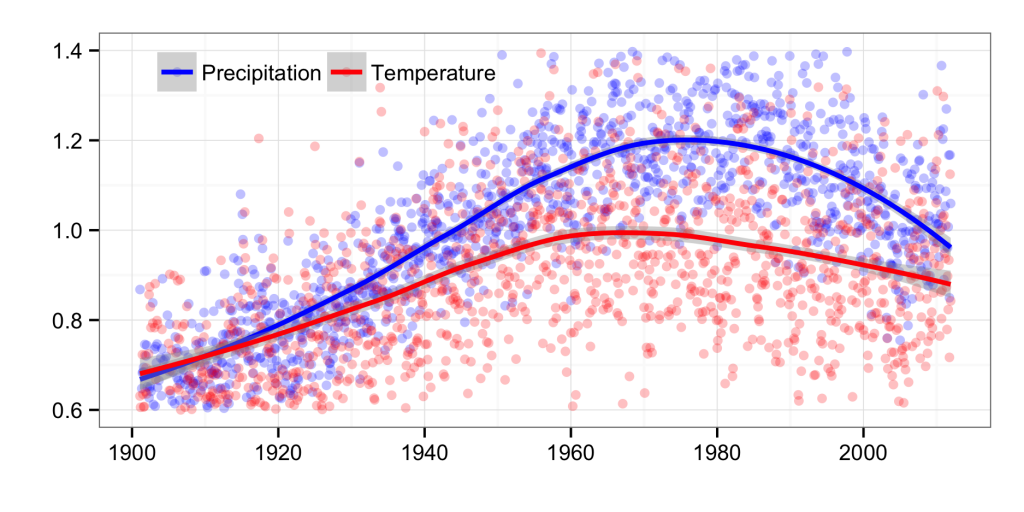
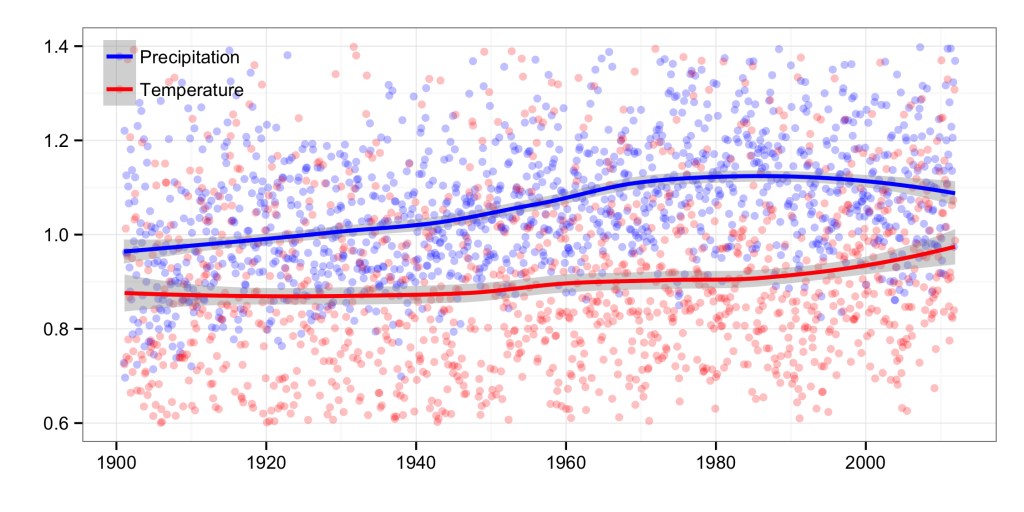
We know that changes in the sample size result in changes in the variance of gridded data that are merely an effect of the interpolation process and not the result of a true climatic signal. This comes from the mathematical theory behind the interpolation methods used to create the grids, but it can also be demonstrated through simulation or by analyzing the most popular gridded datasets. For example, a very different picture about the time evolution of temperature and precipitation anomalies is obtained if one examines the complete datasets or if one uses only the data from those grid cells which contained at least one ground observation.

Time series of global precipitation and temperature standard deviation (in standardized units) in the CRU TS 3.21 dataset (excluding dummy cells).

Time series of global precipitation and temperature standard deviation (in standardized units) in the CRU TS 3.21 dataset (excluding all cells without ground observations).
It is evident that ignoring the spurious changes in spatial and temporal variance introduced by changes in the number and spatial distribution of climatic observations in gridded datasets may lead to wrong conclusions about changes in climate variability and extremes. It is not a definitive problem, though, since standard interpolation techniques may be avoided for constructing climatic grids in favor of statistical simulation approaches that provide a better representation of climate variability.
Find more information on this topic on: S. Beguería, S. M. Vicente-Serrano, M. Tomás-Burguera, and M. Maneta (in press), Bias in the variance of gridded data sets leads to misleading conclusions about changes in climate variability. International Journal of Climatology.
Sin comentarios